 BAM GeoPortal
Communications
Type of resources
Topics
Keywords
Contact for the resource
Provided by
Formats
Representation types
Update frequencies
status
Scale
Regions
Categories
-
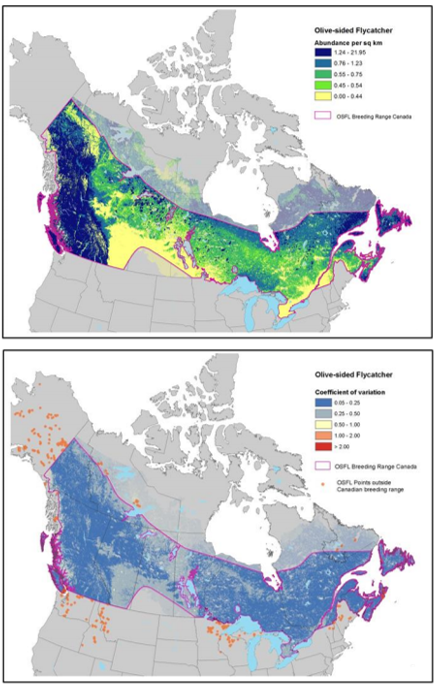
Information from over 1.5 million avian point count surveys were used with land cover, disturbance, topography, climate, and spatio-temporal variables to generate 9 model subsets that explained the variation in abundance of the three focal species across Canada. We used different model subsets to account for different spatial extents and co-linearity among variables. Poisson log-linear regression models were produced using a branching hierarchy model building process and bootstrap procedures to account for model uncertainty. Model validation suggested that our habitat models had very good predictive and discriminatory power. We compared our population estimates to those derived from data and methods used by Partners in Flight. This exercise highlighted important discrepancies in population size estimates when using different analytical approaches and including off-road surveys. Although our habitat models were derived from the best available information, we provided a detailed list of future studies required to address remaining gaps in the breeding ecology and habitat modelling of these species.
-

Maps representing near-national waterfowl density and abundance of 13 individual species and 4 species groups (goldeneyes, mergansers, scoters, and scaup). Predictive models were built using Boosted Regression Tree analysis, data from the Waterfowl Breeding Population and Habitat Survey, and several environmental datasets. Methods used to create 17 species-level models are described in Barker et al. 2014 (ACE 9(2): 7). Guild-Level Maps (cavity nesters, ground nesters, and overwater Nesters) were produced by summing species-level observations and then built models at the guild level. The prediction of total waterfowl abundance was produced by summing the predictions from guild-level models (cavity nesters, ground nesters, and overwater nesters). Species specific model uncertainty are also provided.
-

Baseline (1996–2017) and projected (2011-2100) maps of predicted mean indicated breeding pairs (IBP) and standard deviation (SD) for the 12 waterfowl species in Eastern Canada. Projected means were summarized for the three 30-year periods under the “low” (RCP4.5) and “high” (RCP8.5) greenhouse gas concentration trajectories. From the projected abundances, we also computed maps of climate suitability indices per 12 species. PDF maps and spatial data objects (TIFF files) for the four time-lag schemes under “low” (RCP4.5) and “high” (RCP8.5) greenhouse gas concentration trajectories.
-
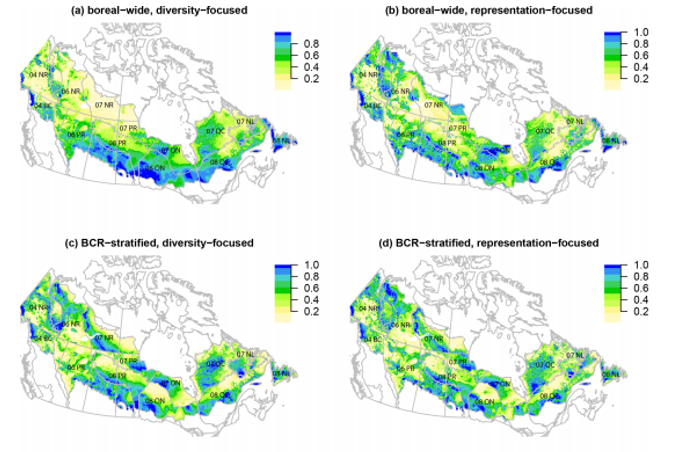
Zones prioritaires pour la conservation des oiseaux chanteurs boréaux au Canada : Résultats de 128 scénarios pour 63 espèces de passereaux basés sur le logiciel de planification de la conservation Zonation.
-

Species-specific spatiotemporal abundance for 18 waterfowl species across Canada based on annual species counts of 2,227 aerial-survey segments over a period of 25 years (1990–2015). Combining machine-learning and hierarchical regression modelling, we created maps and spatial data objects (TIF files) of recorded total indicated pairs (TIP), predicted TIP, Gaussian Markov random fields (GMRFs) and conditional predictive ordinates (CPO).
-

Species specific mean projections and uncertainty estimates (coefficient of variation) of80 boreal-breeding songbird species generated using boosted regression tree models for the current period (based on climate data from 1961-1990) and three future time periods (2011–2040, 2041–2070, 2071–2100).