 BAM GeoPortal
GeoTIFF
Type of resources
Topics
Keywords
Contact for the resource
Provided by
Formats
Representation types
Update frequencies
status
Scale
Regions
Categories
-
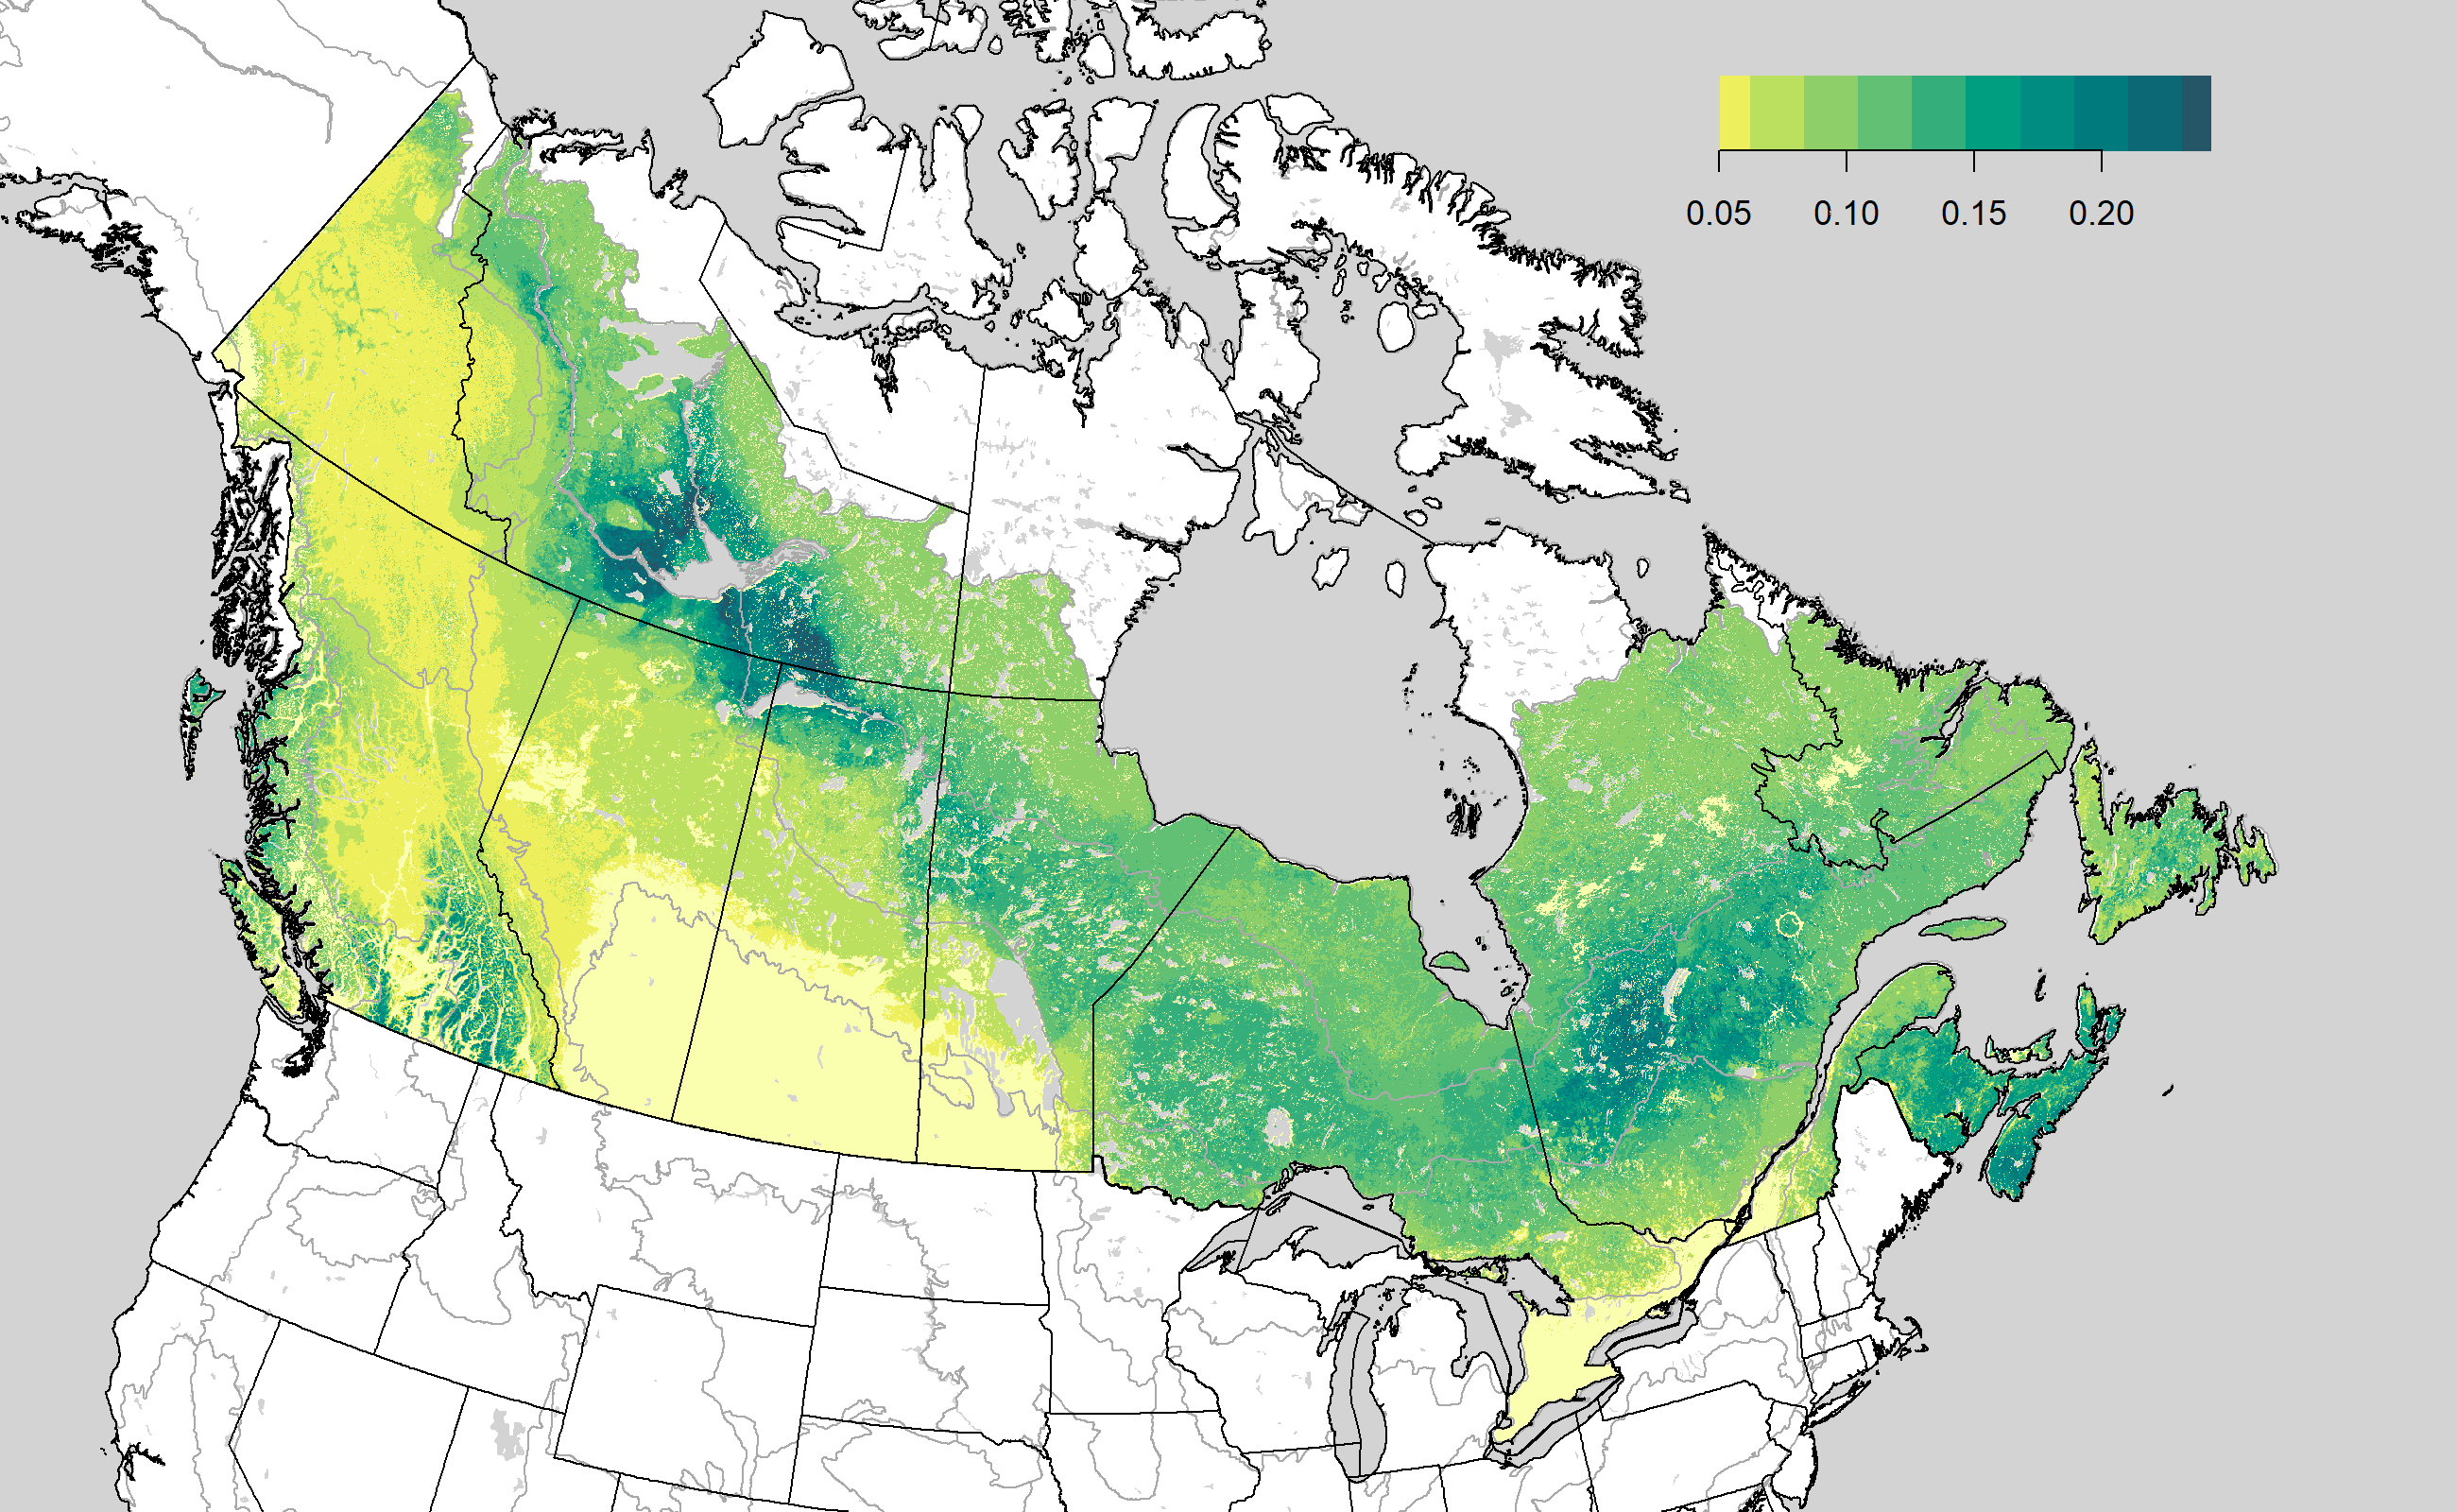
Maps of density (males/ha) in relation to environmental covariates, using the Boreal Avian Modelling Project database of point-count surveys.
-

Maps representing near-national waterfowl density and abundance of 13 individual species and 4 species groups (goldeneyes, mergansers, scoters, and scaup). Predictive models were built using Boosted Regression Tree analysis, data from the Waterfowl Breeding Population and Habitat Survey, and several environmental datasets. Methods used to create 17 species-level models are described in Barker et al. 2014 (ACE 9(2): 7). Guild-Level Maps (cavity nesters, ground nesters, and overwater Nesters) were produced by summing species-level observations and then built models at the guild level. The prediction of total waterfowl abundance was produced by summing the predictions from guild-level models (cavity nesters, ground nesters, and overwater nesters). Species specific model uncertainty are also provided.