 BAM GeoPortal
environment
Type of resources
Available actions
Topics
Keywords
Contact for the resource
Provided by
Formats
Representation types
Update frequencies
status
Scale
Regions
Categories
-

Maps representing near-national waterfowl density and abundance of 13 individual species and 4 species groups (goldeneyes, mergansers, scoters, and scaup). Predictive models were built using Boosted Regression Tree analysis, data from the Waterfowl Breeding Population and Habitat Survey, and several environmental datasets. Methods used to create 17 species-level models are described in Barker et al. 2014 (ACE 9(2): 7). Guild-Level Maps (cavity nesters, ground nesters, and overwater Nesters) were produced by summing species-level observations and then built models at the guild level. The prediction of total waterfowl abundance was produced by summing the predictions from guild-level models (cavity nesters, ground nesters, and overwater nesters). Species specific model uncertainty are also provided.
-
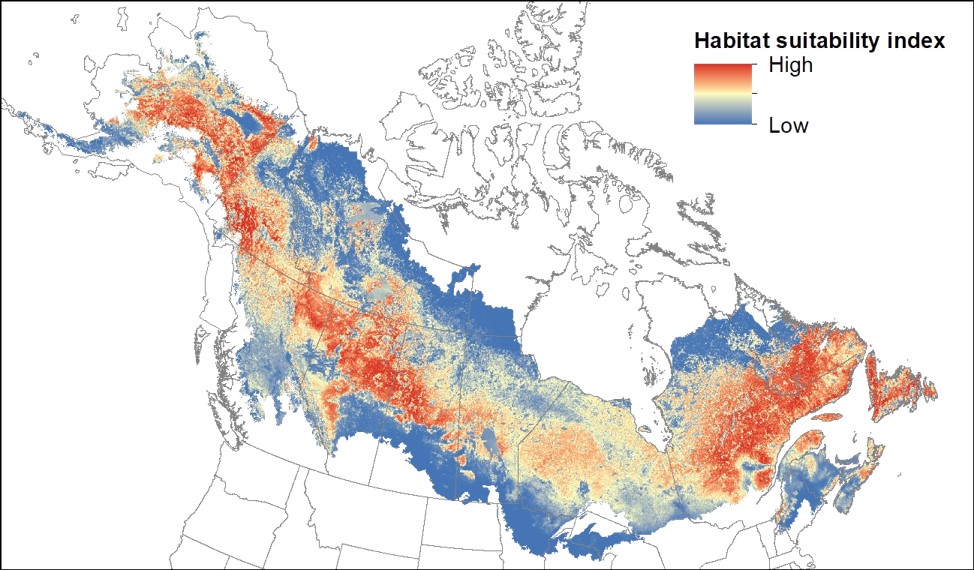
Maps depict model-predicted species distribution and provide information about relative habitat suitability based on current climate and landcover. The suitability ranking of any mapped grid cell is the sum of the probabilities of that grid cell and all other grid cells with equal or lower probability, multiplied by 100 to give a percentage. This value represents the % of grid cells with a lower suitability value within the boreal/hemiboreal study region. Higher value pixels represent higher habitat suitability for a given species.
-

Baseline (1996–2017) and projected (2011-2100) maps of predicted mean indicated breeding pairs (IBP) and standard deviation (SD) for the 12 waterfowl species in Eastern Canada. Projected means were summarized for the three 30-year periods under the “low” (RCP4.5) and “high” (RCP8.5) greenhouse gas concentration trajectories. From the projected abundances, we also computed maps of climate suitability indices per 12 species. PDF maps and spatial data objects (TIFF files) for the four time-lag schemes under “low” (RCP4.5) and “high” (RCP8.5) greenhouse gas concentration trajectories.
-
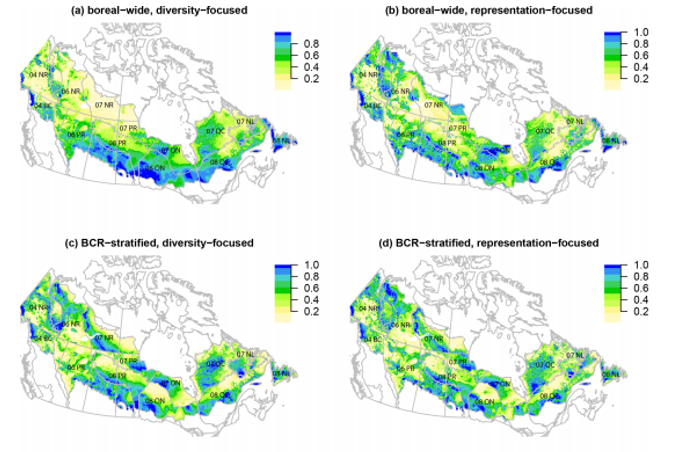
Zones prioritaires pour la conservation des oiseaux chanteurs boréaux au Canada : Résultats de 128 scénarios pour 63 espèces de passereaux basés sur le logiciel de planification de la conservation Zonation.
-
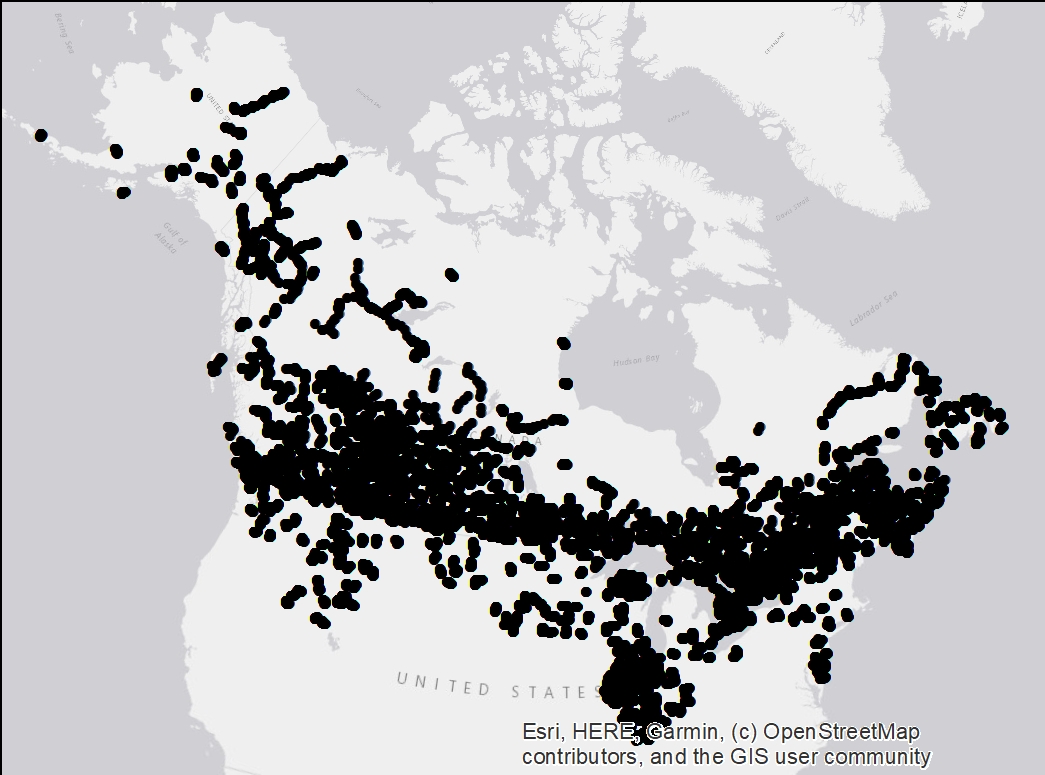
BBS is a cooperative effort between the U.S. Geological Survey's Patuxent Wildlife Research Center and Environment Canada's Canadian Wildlife Service to monitor the status and trends of North American bird populations. Geospatial data are assembled at the route level and are accessible throught the USGS website. Over the years, BAM staffs with the help of CWS succeeded to assemble a set of coordinates at the Stop level for some of the Canadian and North of the USA routes. A total of 70677 stops locations, mostly across Canada, are mapped in ESRI shapefile format. Those coordinates were then used to convert BBS data into the latest BAM database format (v6). Reach Point of Contact mentionned below to access BBS_BAM harmonized data.