 BAM GeoPortal
Reports
Type of resources
Keywords
Contact for the resource
Provided by
Formats
Representation types
Update frequencies
status
Scale
Regions
Categories
-
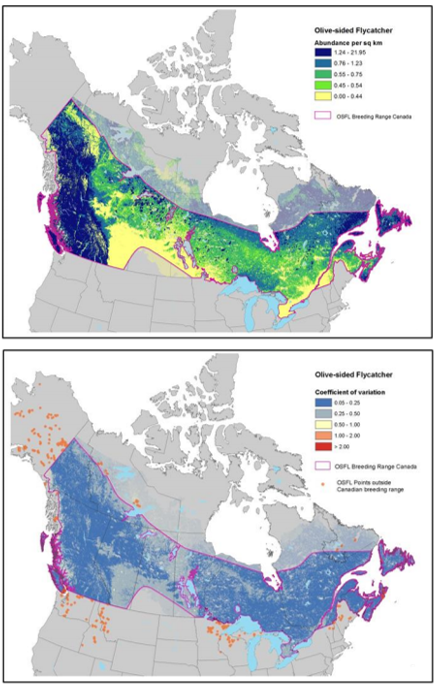
Information from over 1.5 million avian point count surveys were used with land cover, disturbance, topography, climate, and spatio-temporal variables to generate 9 model subsets that explained the variation in abundance of the three focal species across Canada. We used different model subsets to account for different spatial extents and co-linearity among variables. Poisson log-linear regression models were produced using a branching hierarchy model building process and bootstrap procedures to account for model uncertainty. Model validation suggested that our habitat models had very good predictive and discriminatory power. We compared our population estimates to those derived from data and methods used by Partners in Flight. This exercise highlighted important discrepancies in population size estimates when using different analytical approaches and including off-road surveys. Although our habitat models were derived from the best available information, we provided a detailed list of future studies required to address remaining gaps in the breeding ecology and habitat modelling of these species.
-
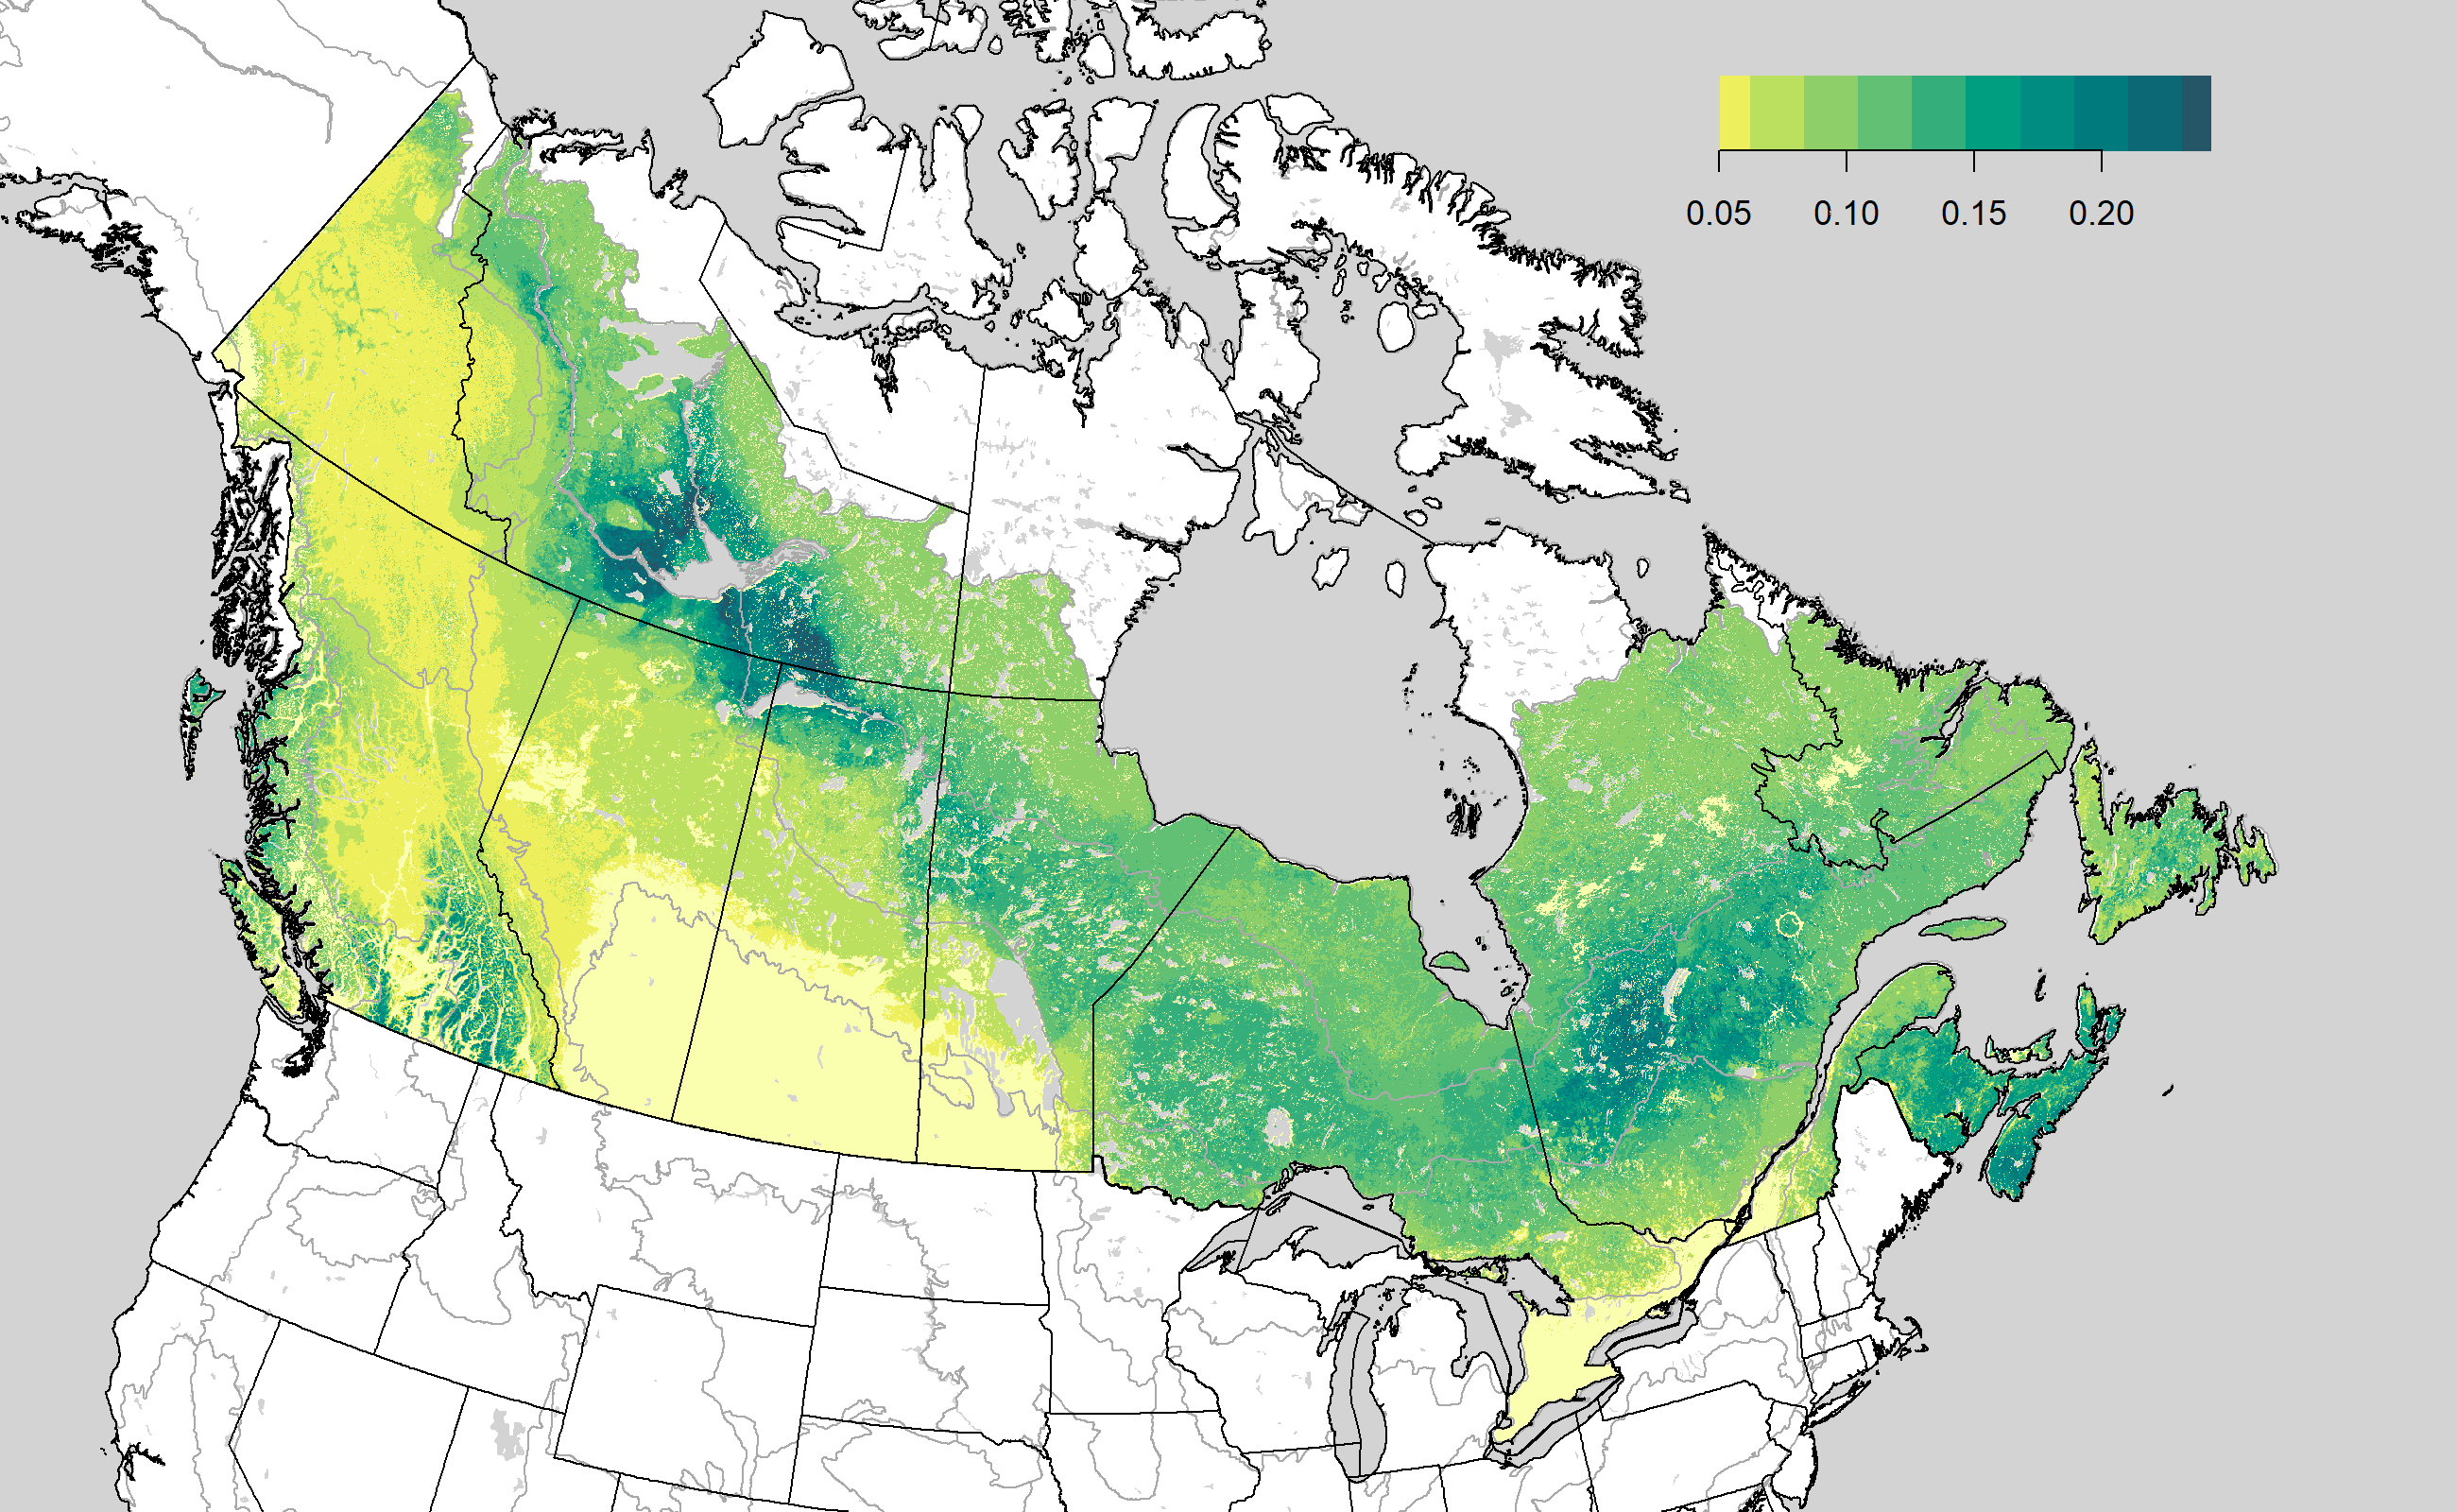
Maps of density (males/ha) in relation to environmental covariates, using the Boreal Avian Modelling Project database of point-count surveys.
-
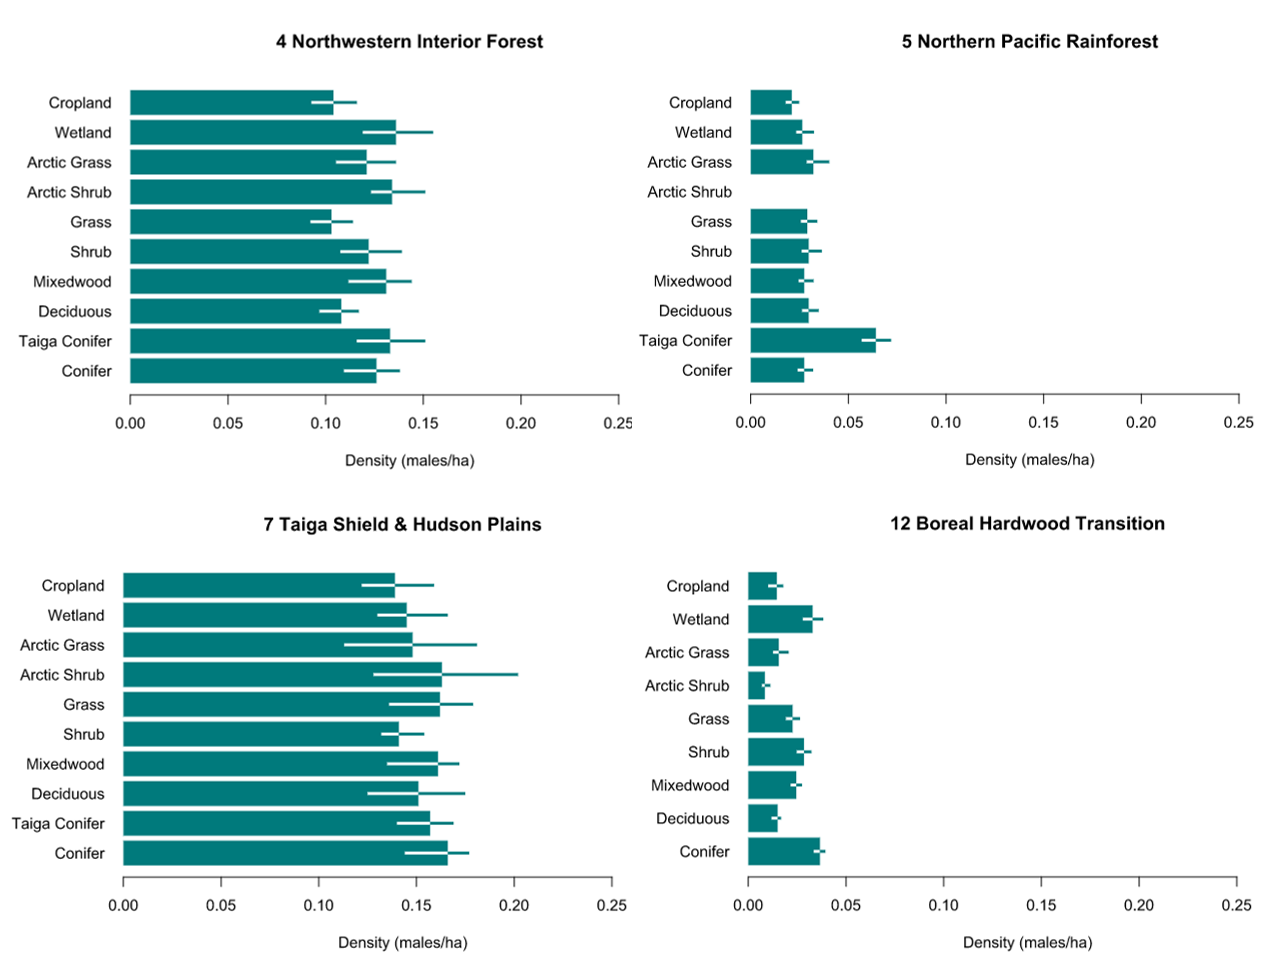
Tables representing species specific mean density(males/ha) by region and landcover classes. Models for each bird conservation regions (BCRs) intersecting Canadian jurisdictional boundaries were based on covariates such as tree species biomass (local and landscape scale), forest age, topography, land use, and climate. We used a post-hoc stratification (‘post-stratification’) approach to estimate land cover based density estimates (males per ha) for each species and regions (Canada and subunits). We classified the predictive maps according to the 2005 MODIS-based North American landcover map into major land cover types (Conifer, Taiga Conifer, Deciduous, Mixedwood, Shrub, Grass, Arctic Shrub, Arctic Grass, Wetland, Cropland) and calculated the mean of the pixel level predicted densities. Uncertainty was based on the 5th and 95th percentiles of the bootstrap distribution.